
Loading...

Producing a submission-ready statistics report comes down to following a tested sequence: plan the question, draft the analysis, write the sections in the right order, then run three editing passes for structure, numbers, and formatting. This guide covers that workflow for students and academics writing statistics reports, essays, or research papers, not for solving individual problem sets. If you want assisted editing along the way, we outline how that fits in later.
TL;DR:
- A complete report needs a 150 to 250 word abstract, plus distinct sections for methods, results, discussion, references, and supporting tables or figures.
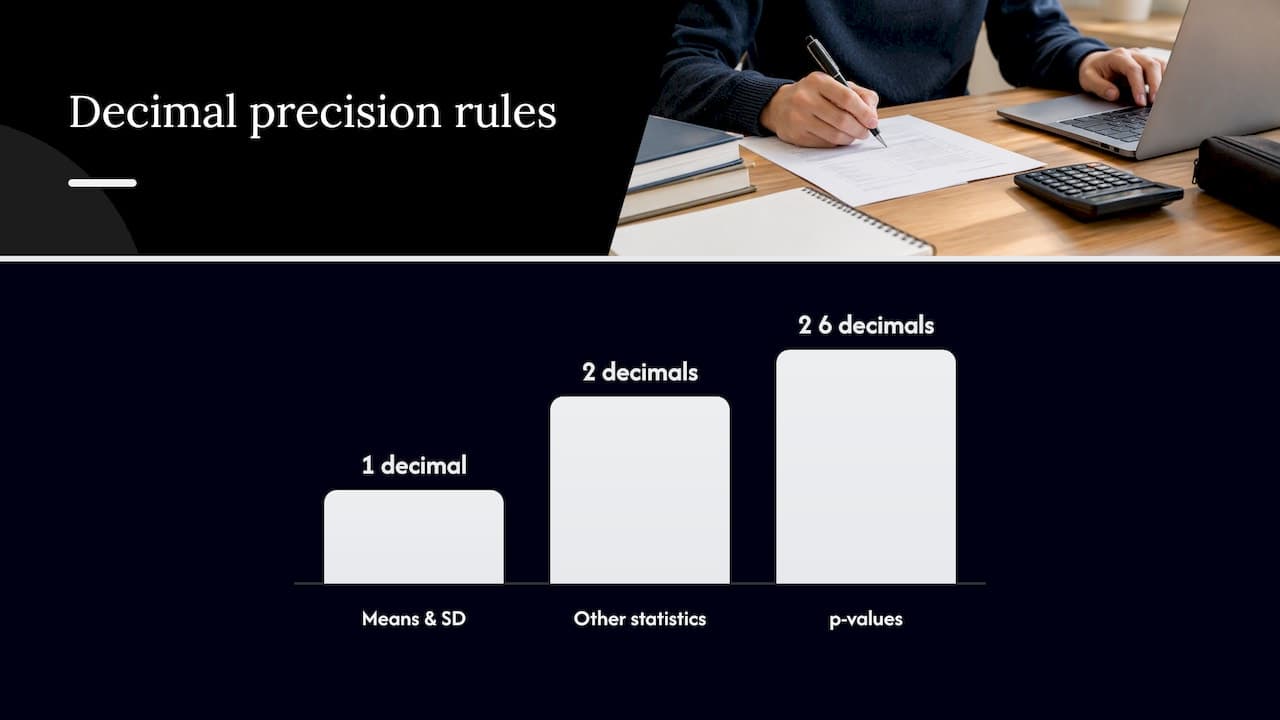
- Use one decimal for means and standard deviations on integer scales, two for most other statistics, and report p values to two or three decimals.
- Match test choice to design: paired t tests suit repeated measurements, ANOVA compares three or more group means, and nonparametric tests often suit ordinal data.
- Use tables for exact values, such as group means, and figures for trends, distributions, or interactions; label visuals and cite them in the text.
- Document file order, code, software versions, missing data decisions, and transformations; a README, version control, and an analysis log help others rerun the work.
A statistics report follows a fairly fixed anatomy, and graders and reviewers notice immediately when a section is missing or misplaced. The standard structure includes a title page, abstract, introduction, methods, results, discussion or conclusion, references, and supporting tables or figures.
Each section has one job. When methods start explaining results, or discussion repeats numbers instead of interpreting them, the report reads as unfinished even if every number is correct.
Most statistics reports fail not because the analysis is wrong, but because the writing was drafted in the wrong order. A workflow that matches how the argument actually comes together saves rewrites later.
Pro Tip: Write your abstract last. It is easier to summarize a report you have already finished than to predict one you have not written yet.
Precision in reporting matters as much as precision in the analysis itself. Reviewers and instructors read numbers as evidence of whether you understand what you ran, not just whether you ran it.
A reporting convention worth memorizing: APA numeric guidelines generally call for two decimal places for most other statistics beyond means and standard deviations, which keeps tables consistent across a whole report.
Nonsignificant findings deserve the same care as significant ones. Describe them plainly rather than claiming "no effect," and offer a plausible reason the pattern did not reach significance, a practice experimental report guidance treats as essential to honest interpretation.
The choice between a table and a figure is not stylistic. APA guidance frames tables as the right tool for organized numerical values, and figures as the right tool for visual patterns or relationships.
Reproducibility is not an extra credit item anymore in many statistics courses and journals; it is part of what counts as a complete report. The American Statistical Association frames reproducibility as a continuum, where even small steps toward documentation improve credibility.
Pro Tip: Add one short paragraph at the end of your methods stating exactly what is available (data, code, or both) and how someone would rerun your analysis. That single paragraph often satisfies both grading rubrics and submission guidelines.
Before you submit, run through the same checks a grader or reviewer runs through first.
| Checklist area | What to verify |
|---|---|
| Alignment | Results answer the stated research question |
| Numeric accuracy | Decimals and p-values formatted consistently |
| Visuals | Every table and figure labeled and referenced |
| References | Citation style matches assignment requirements |
| Integrity | Plagiarism scan run, reproducibility note included |
Formatting details like margins, spacing, and appendix placement rarely sink a report on their own, but they compound with other issues when a grader is deciding between two similar scores.
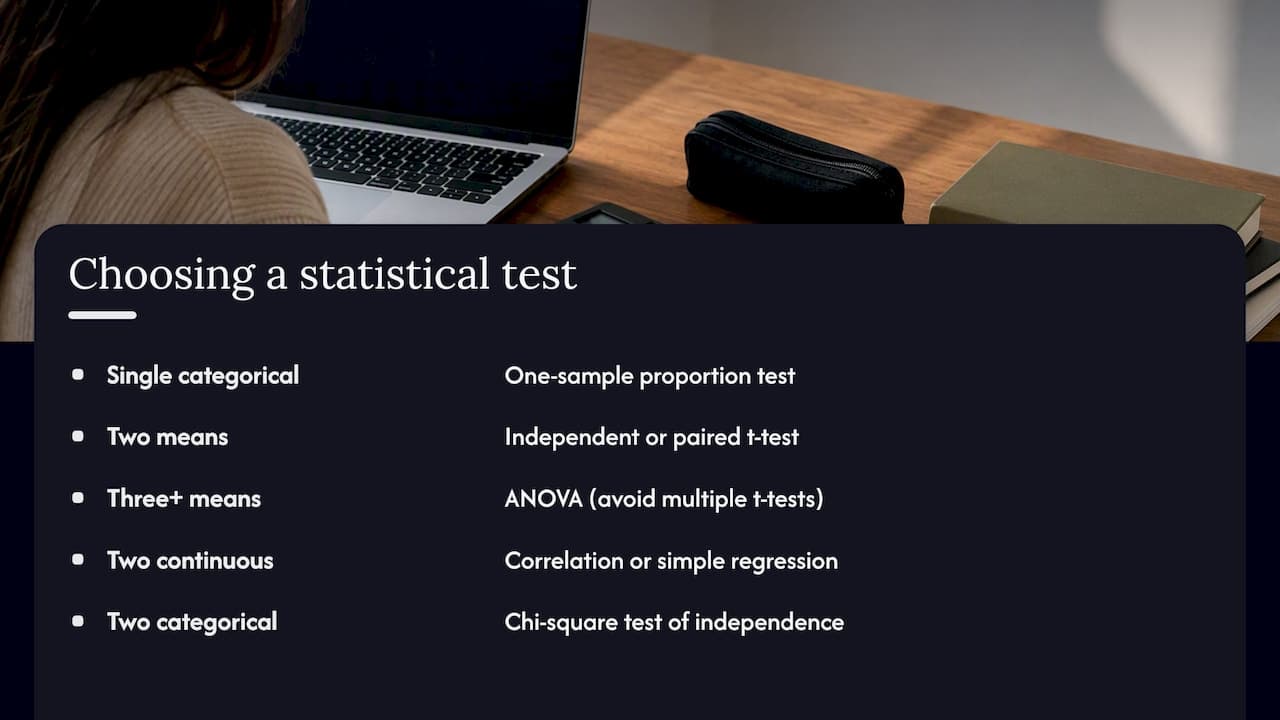
Most homework problems signal the correct test through their variable types and the question being asked, not through the chapter they appear in. Start by identifying how many variables are involved and whether they are categorical or continuous.
A single categorical variable against a known proportion points to a one-sample proportion test. Two independent group means point to an independent-samples t-test, while two related measurements on the same subjects point to a paired t-test. Comparing three or more group means calls for ANOVA rather than running multiple t-tests, which inflates the chance of a false positive. A relationship between two continuous variables points to correlation or simple regression, and a relationship between two categorical variables points to a chi-square test of independence.
The sample size and what you know about the population also matter. Small samples with unknown population standard deviations generally call for t-distributions rather than z-distributions. Non-normal distributions or ordinal data often call for a nonparametric alternative, such as the Mann-Whitney U test in place of an independent t-test.
Write the research question first, then ask what kind of comparison it implies (a difference between groups, a relationship between variables, or a single estimate against a benchmark). That question almost always narrows the test choice to one or two candidates before you touch the data.
A handful of errors show up repeatedly across statistics assignments, and most are avoidable once you know to look for them.
Rounding too early is one of the most common. Carrying only two decimal places through intermediate calculations and rounding only at the final answer prevents compounding error. Confusing the null and alternative hypotheses is another, especially when a problem is phrased in a way that makes the directional claim ambiguous: write both hypotheses out in full sentences before running any test.
Misreading what a p-value means causes real damage to an otherwise correct analysis. A p-value does not tell you the probability the null hypothesis is true, and a nonsignificant result does not prove there is no effect. State what the test actually showed rather than overclaiming or underclaiming it.
Mismatching the test to the data type, like running a t-test on clearly non-normal or ordinal data, is another frequent issue, along with forgetting to check assumptions such as independence or equal variances before trusting the output. Finally, pasting raw calculator or software output directly into a written answer without translating it into a sentence a reader can follow loses points even when the number is correct.
A consistent sequence prevents the two most common failure points: misreading the problem and miscalculating under time pressure.
Start by restating the question in your own words, including what is being compared and what the expected direction of the result might be. Identify the variables and their types, then write out the null and alternative hypotheses explicitly. Choose the appropriate test based on those variable types and the sample size, then list the assumptions that test requires and check whether the problem's data satisfies them.
Calculate the test statistic step by step rather than jumping to a calculator shortcut, since showing the intermediate values (the mean difference, the standard error, the degrees of freedom) makes it far easier to catch an arithmetic slip. Compare the test statistic to the appropriate critical value or compute the exact p-value, then state the decision about the null hypothesis in plain language tied back to the original question.
Finish by writing a one or two sentence conclusion that answers the question as it was originally asked, not just "reject the null." A grader reading only that final sentence should understand what you found and what it means for the scenario in the problem.
Software removes the arithmetic burden but adds a different risk: trusting output you do not fully understand. Before running any procedure in a graphing calculator, Excel, SPSS, R, or a similar tool, know what each number in the output represents.
Label your variables clearly in the software before analysis, matching the names used in your written report so the output maps directly back to your methods section. Run a quick sanity check on your own, such as a rough mean or proportion by hand, before trusting the software's number for the same statistic. Save your work with consistent file names and, where the software supports it, keep a short log of which settings or options you selected, since many tools default to slightly different formulas (population versus sample standard deviation, for instance) that change the answer.
Never copy the full output screen into your written answer. Pull out only the values your report needs (the test statistic, degrees of freedom, p-value, and relevant estimate) and present them in a sentence or small table.
A simple verification habit catches more errors than a second attempt at the same calculation. Recalculate key results using a second method when possible, such as checking a regression slope by hand against software output, or confirming a proportion with a quick mental estimate.
Keep a running log of your answers as you work through an assignment, noting which test you used for each question and any assumptions you checked. This makes it far easier to spot a pattern of the same mistake across multiple problems, such as consistently confusing one-tailed and two-tailed critical values.
Before submitting, reread each question and confirm your final answer actually addresses what was asked, not just what you calculated. A technically correct test run on a misread question still earns no credit. Where the assignment allows, compare your approach with a classmate's on method choice alone, not on final numbers, since talking through why a particular test applies cements the reasoning far better than comparing answers.
When you look for outside help on a statistics report, the first distinction to make is between one-off problem solving and ongoing writing and editing support. A tutor explaining a single hypothesis test is solving a different problem than an editor helping you structure, format, and polish a full report, and the right kind of help depends on which one you actually need.
For writing-focused support, look for services that address the structural weaknesses graders flag most often: unclear research questions, disorganized methods sections, inconsistent numeric formatting, and missing limitations. Ask whether a service helps with citation formatting in the style your course requires, whether it can incorporate sources you provide, and whether it includes any check for originality before you submit. Be wary of any tutoring help that produces finished answers without explaining the reasoning, since that undermines the point of an assignment designed to test your understanding.
A reasonable evaluation checklist: does the service explain structure and reasoning rather than just supplying output, does it support the citation style your report needs, and does it give you a way to verify the final draft before submission. The right kind of outside help should make your writing and formatting stronger without replacing the thinking the assignment is meant to build.
When we review a statistics report, we check the research question against the results before anything else. A beautifully formatted report that never answers its own question is a bigger problem than a messy table.
After that, we look for the same recurring issues: methods sections padded with detail the results never use, raw output dropped into results, missing limitations, and decimals that shift between one and two places across a single report. A focused pass on those four things fixes more of the grade than a line-by-line formatting sweep.
— Tilen
Each stage of this workflow has a direct counterpart in what we built. Guided Essays help you lay out the title, methods, results, and discussion structure before you write a single sentence of the draft. The Power Editor handles the second pass, tightening clarity and expanding thin sections like limitations or methods once the structure is set.
We offer a Free Plan for uploading a draft and running initial formatting and citation checks, with an Academic Plan available when you need extended editorial passes, higher word limits, or ongoing support across a full research paper or literature review. If you already have a draft, the Upload Essay tool is the fastest way to start.
A complete report includes a title, abstract, introduction with a clear research question, methods describing your variables and sampling, results ordered from descriptive to inferential statistics, a discussion of limitations, and a reference list, following the standard report structure.
Most means and standard deviations on integer-scale measures are reported to one decimal place, while many other statistics use two, and exact p values are typically reported to two or three decimals with "p < .001" used for very small values.
Use a table when the reader needs exact numeric values, like means across groups, and use a figure when the pattern or relationship matters more than the exact numbers, following the distinction APA style draws between the two.
A reproducible report documents your data, code, and analytic decisions clearly enough that someone else could rerun it, following practices like version control, scripted analysis, and published code and data recommended by the American Statistical Association.
Yes, our Reference Builder formats citations in APA and MLA, our Power Editor refines methods and discussion sections, and our Guided Essays provide structure for a full report, available through our Free Plan or Academic Plan.